How it works
How the Website Speed Test works
 How the Website Speed Test works
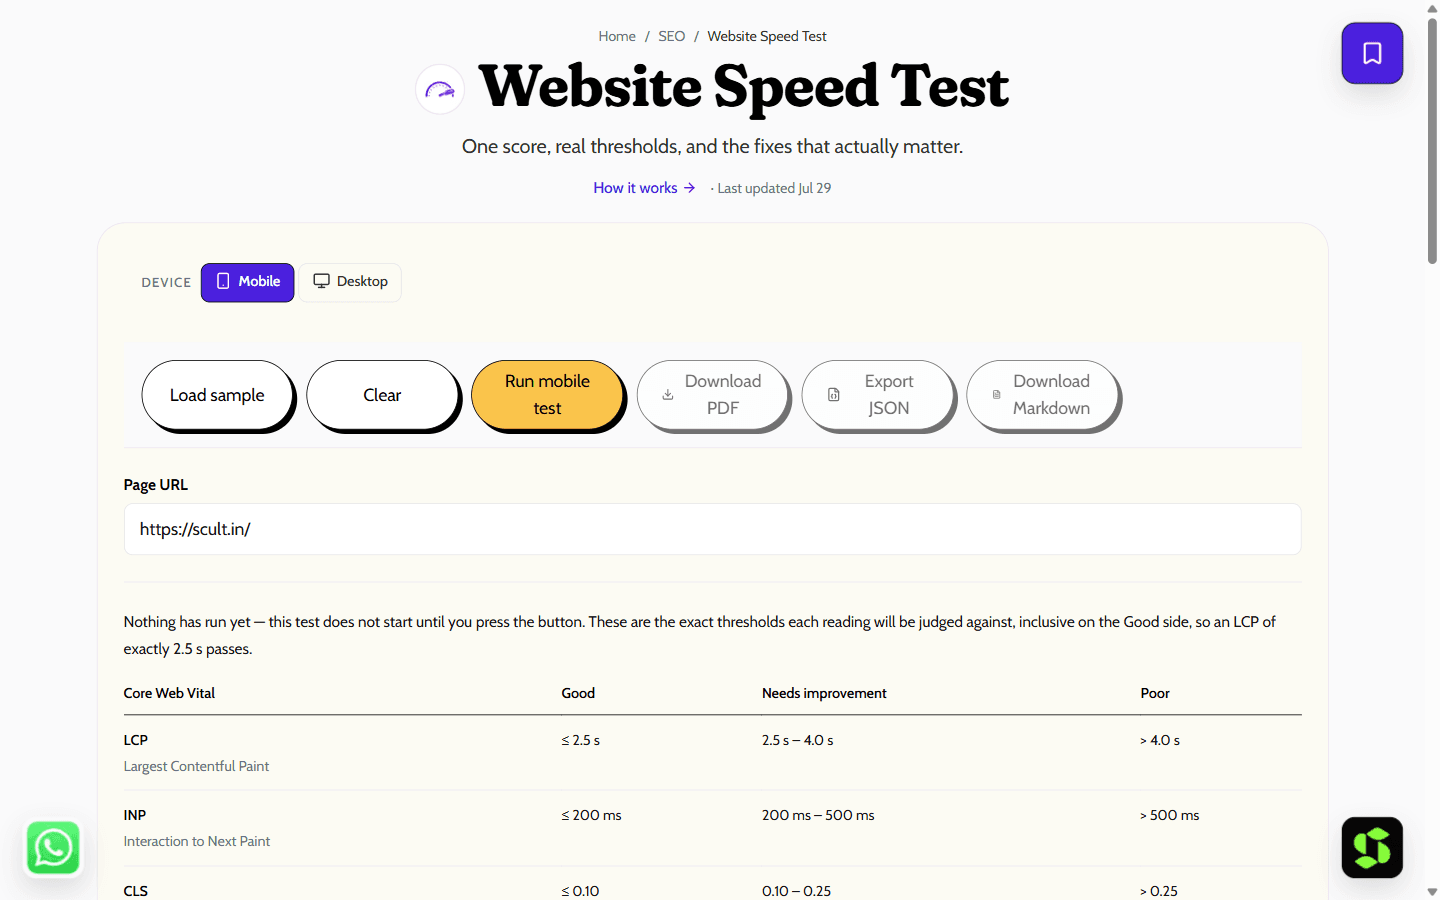
Run Google’s own Lighthouse on any page and get a verdict, not a wall of numbers: Core Web Vitals against real thresholds, plus the five fixes worth doing first.
Last updated Jul 29
Try Website Speed Test nowThe method
Runs Google’s own Lighthouse engine via the free PageSpeed Insights v5 API — the same test behind pagespeed.web.dev. It reports lab data (one simulated Chrome load) and field data (CrUX: real users at the 75th percentile). Each Core Web Vital is scored against Google’s published Good/Poor thresholds; it also surfaces server response time (TTFB), the third-party scripts costing the most main-thread time, and a transfer-size breakdown by resource type. Retests of the same URL are cached for 6 hours.
Step by step
- 1
Paste the full URL of the page you want to test — a specific landing page, not just the homepage.
- 2
Pick mobile or desktop. Mobile is what Google ranks you on, so start there.
- 3
Run the test and wait 15–40 seconds while Google loads your page in a real Chrome instance.
- 4
Read the verdict, then start with the top opportunity — it carries the largest estimated saving.
- 5
Test the same URL and device again later — your browser remembers the last score for that exact combination and shows how many points moved.
What it doesn't do
- A lab score is one run from one Google data centre, so a few points of swing between runs is normal — treat trends as meaningful, single runs as indicative.
- Field (CrUX) data only exists when a page gets enough Chrome traffic; smaller pages may fall back to origin-wide data or none at all.
Score bands at a glance
| Score | Band | Core Web Vital | Good threshold |
|---|---|---|---|
| 90–100 | Good | LCP (loading) | ≤ 2.5 s |
| 50–89 | Needs improvement | INP (responsiveness) | ≤ 200 ms |
| 0–49 | Poor | CLS (visual stability) | ≤ 0.10 |
The fixes that move the needle
Fix LCP (loading) first — it usually has the biggest single-image win:
- Compress and correctly size your largest image; serve WebP or AVIF instead of JPEG/PNG where you can.
- Preload the hero image so the browser fetches it immediately, and lazy-load everything below the fold.
- Improve server response time — caching, better hosting, or a CDN in front of a slow origin.
Fix INP (responsiveness):
- Reduce heavy JavaScript and break up long-running tasks so the main thread frees up between them.
- Remove or defer non-essential third-party scripts — chat widgets and ad/analytics tags are the most common culprits, and this tool's own report ranks them by main-thread cost.
Fix CLS (visual stability):
- Set explicit width and height on every image and embed so the browser reserves space before it loads.
- Reserve space for ads or banners up front instead of letting them push content down once they load.
- Preload web fonts so text doesn't visibly reflow when the real font swaps in.
Image compression, caching, and setting image dimensions fix most sites' biggest problems fastest. Heavier issues — a lot of custom JavaScript, or hosting that's genuinely slow — usually need a developer, not a plugin. Re-test after each change to confirm it actually moved the score.
Frequently asked
What is a good PageSpeed score?
90 or above is Good, 50–89 Needs improvement, and below 50 is Poor. But the score is a lab summary — Google’s ranking systems look at the three Core Web Vitals from real-user data, so a page can rank fine with a mediocre score if its real-user LCP, INP and CLS pass.
Why is my mobile score so much lower than desktop?
The mobile test simulates a mid-range phone with a 4x CPU slowdown on a slow 4G connection, while desktop assumes fast hardware and broadband. Most real traffic is mobile, which is exactly why Google tests it under pressure — and ranks you on it.
What is the difference between lab data and field data, and why might my report show none?
Lab data is one simulated page load run by Lighthouse — controlled and repeatable, good for debugging. Field data is the 75th-percentile experience of real Chrome users over the last 28 days (the CrUX dataset), and it is what Google actually uses to assess Core Web Vitals. Field data only appears once enough real Chrome users have visited a page over that window; below that threshold, PageSpeed Insights falls back to origin-level data, and if the origin is too small too, there is none at all — the report then falls back to this run’s lab metrics instead. Interaction to Next Paint can only ever come from field data, so a page with no field data also has no INP reading.
Does page speed affect Google rankings?
Yes — Core Web Vitals are a confirmed ranking signal, assessed from field data at the 75th percentile. The effect is modest compared with content relevance, but speed also compounds through lower bounce rates and higher conversion, which is usually where the real money is.
Why does my score change every time I run the test?
Run-to-run variance is normal: network conditions, server response times, third-party scripts, rotating ads and A/B tests all shift the numbers. A few points of movement means nothing; consistent movement across several runs is a real change.
What are Core Web Vitals?
Google’s three user-experience metrics: Largest Contentful Paint (loading — Good at ≤2.5s), Interaction to Next Paint (responsiveness — Good at ≤200ms) and Cumulative Layout Shift (visual stability — Good at ≤0.10). A page passes when all three are Good at the 75th percentile of real visits.
Do third-party scripts (ads, analytics, chat widgets) really slow a page down?
Yes — every embedded script adds its own network request and runs JavaScript on the same main thread as your own code, which is exactly what Total Blocking Time and Interaction to Next Paint measure. A single heavy ad network or chat widget can cost more than the rest of the page combined. Lighthouse’s audits already account for this: when a third-party script is expensive enough to be worth fixing, it can appear in the top-five opportunities like any other audit, sorted by estimated saving.
Is it free?
Yes, free with no signup — even though, like the AI Visibility Checker, it runs as a real server request against Google's PageSpeed Insights API rather than entirely in your browser.
Need this built into your business?
This tool is free because it's a small, solved problem. If what you actually need is bigger — web development, built and maintained for you — that's Scult's day job.


